 you
are here » st. joe river homepage
» wmp »
tasks
»
task 4 »
subwatershed level data analysis »
subwatershed scoring
you
are here » st. joe river homepage
» wmp »
tasks
»
task 4 »
subwatershed level data analysis »
subwatershed scoring
you
are here » st. joe river homepage
» wmp »
tasks
»
task 4 »
subwatershed level data analysis »
subwatershed scoring
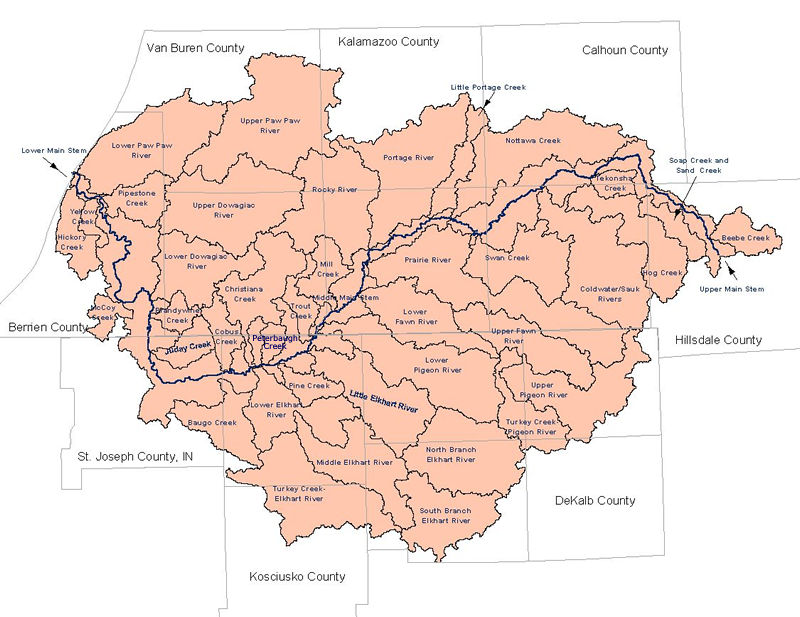
Subwatershed Level Scoring
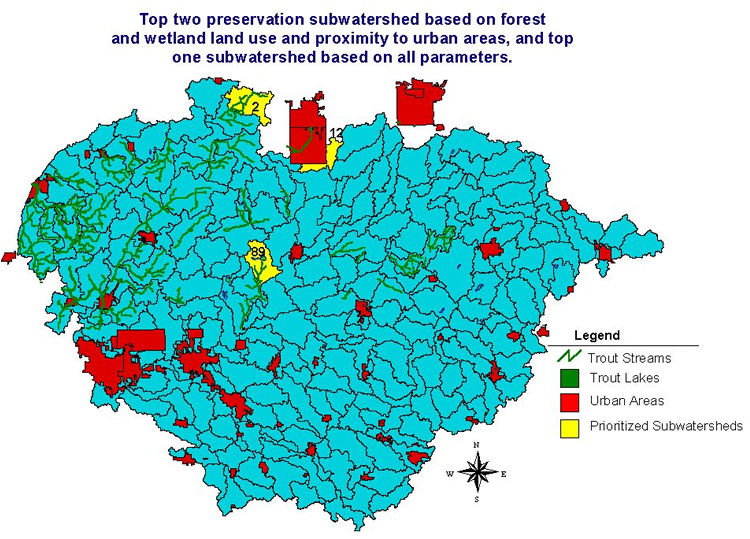
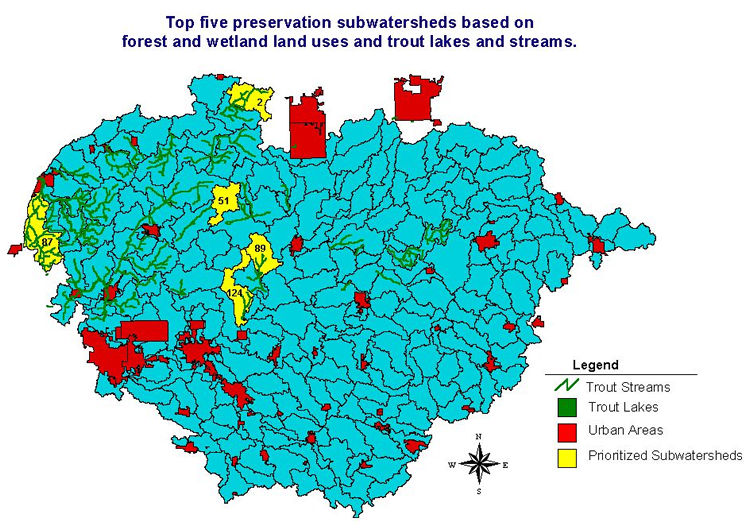
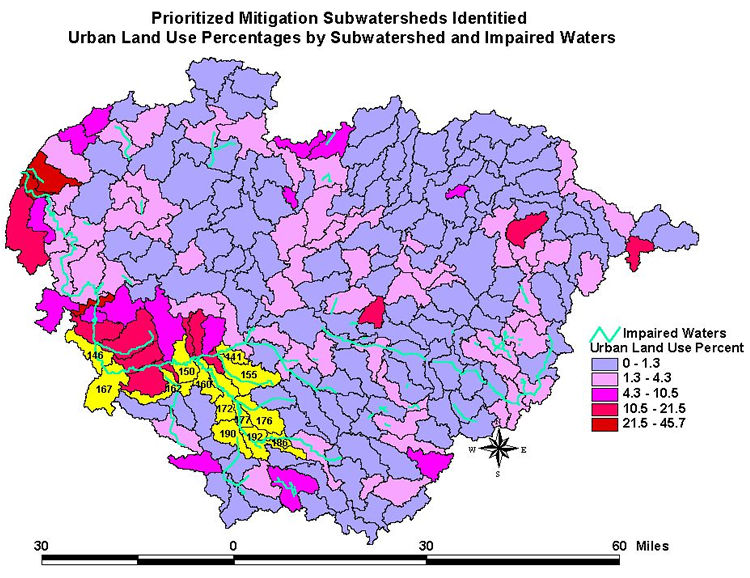
A scoring procedure utilizing available GIS data was developed to rank each subwatershed for preservation and mitigation potential. Spatial attributes, such as land cover and trout streams, were utilized to identify subwatersheds with remaining open space that should be targeted for preservation. Spatial attributes, such as county level population and agricultural census data, land cover and impaired water bodies [303(d) list], were mapped and scored to identify the most impacted subwatersheds (accoring to available GIS data). This exercise represents just one method to identify critical areas for the watershed management plan.
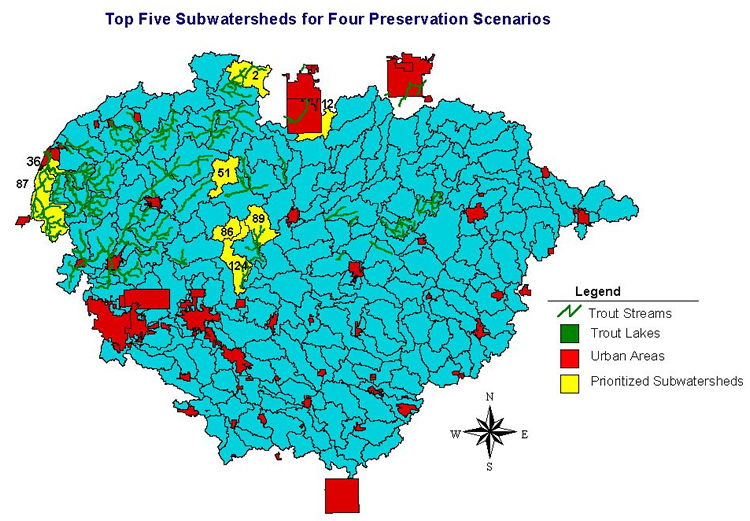
The subwatershed delineation using 30-meter elevation data yielded 217 subwatersheds. Those subwatersheds were combined into 42 major drainage areas, based on major tributaries. The average scores for those units are presented in the figures below and in this report.
Methods to protect or mitigate the identified areas are discussed in the Task 8 report.
Ordinances to encourage preservation.
Ordinances for mitigation areas and agricultural preservation.
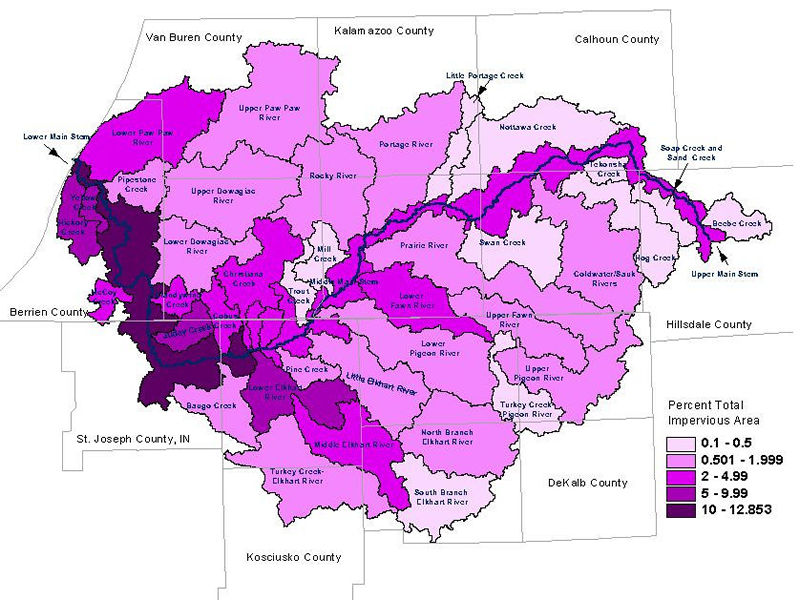
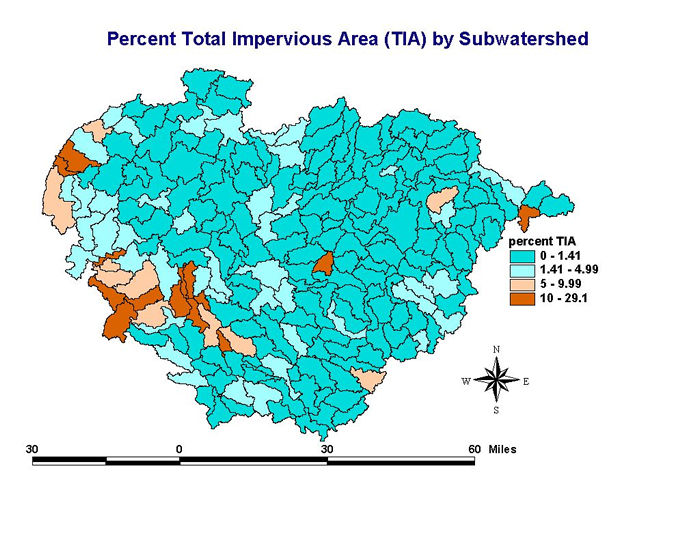
Ordinances based on imperviousness.Attachment A. Scoring for each of 217 subwatersheds. The figures from the report are available as images below. Attachment A can be downloaded as a PDF file.
Figure 1. Proximity to Urban Areas
Proximity to urban areas was mapped to indicated an "urgency" or threat level for areas potentially needing preservation.
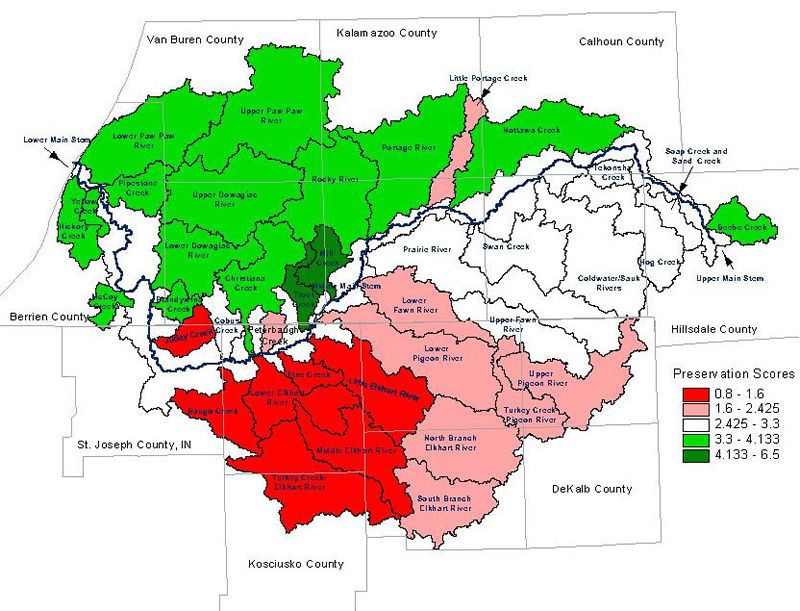
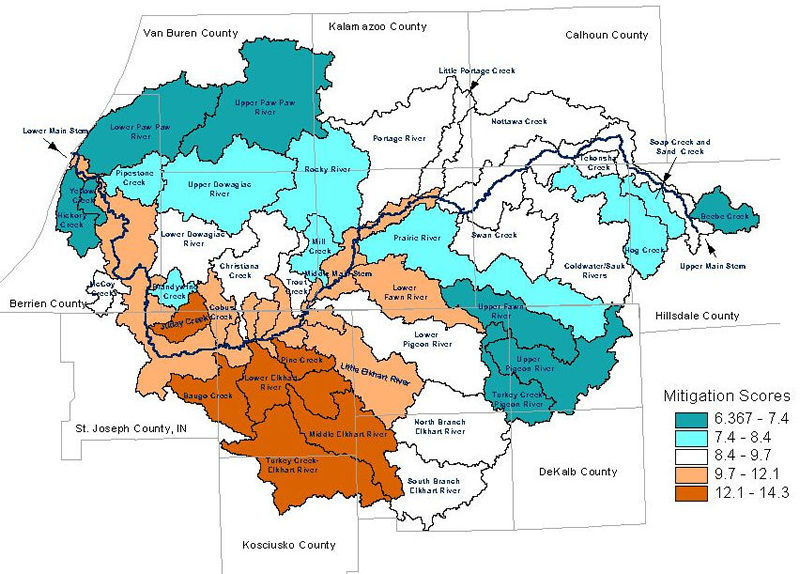
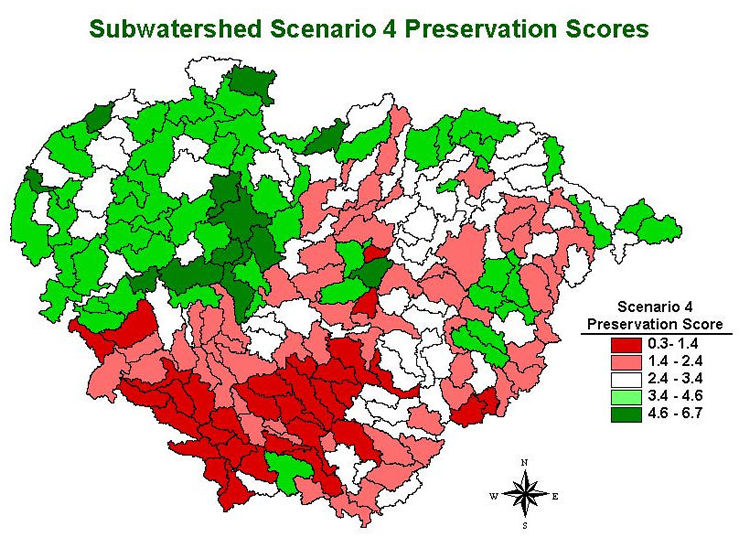
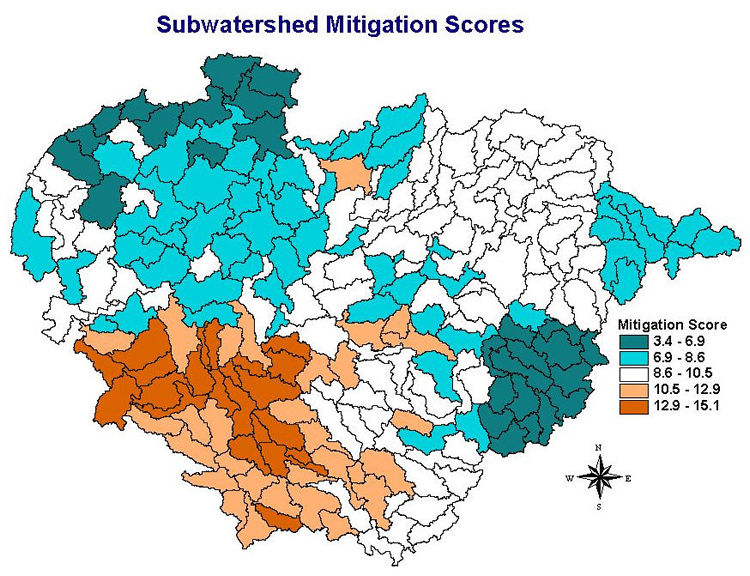
Figure 7. Graduated colors illustrating scenario 4 preservation scores. Figure 8. Graduated colors illustrating mitigation scores.
See also:
- Attachment B: Nonpoint Source Loading by Subwatershed
- Land Use Percentages by Subwatershed
- What are the 217 Subwatersheds?