 you
are here » st. joe river homepage
» wmp » tasks
»
task
2 »
digital elevation modeling
you
are here » st. joe river homepage
» wmp » tasks
»
task
2 »
digital elevation modelingyou
are here » st. joe river homepage
» wmp » tasks
»
task
2 »
digital elevation modeling
|
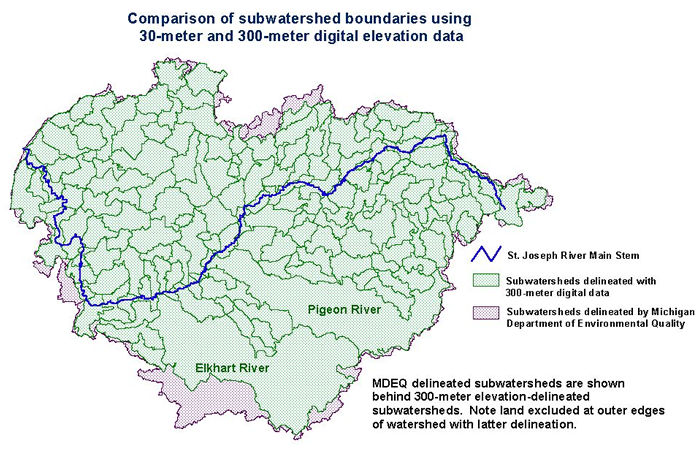
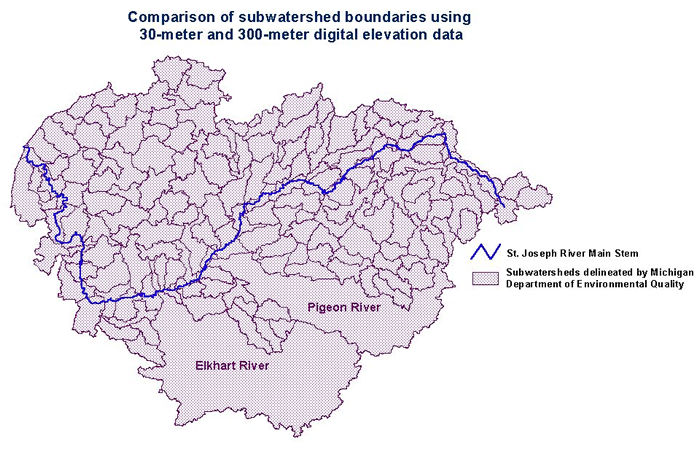
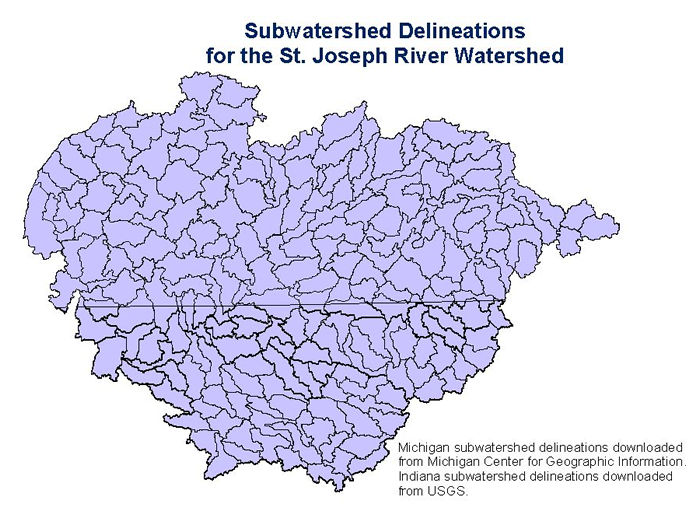
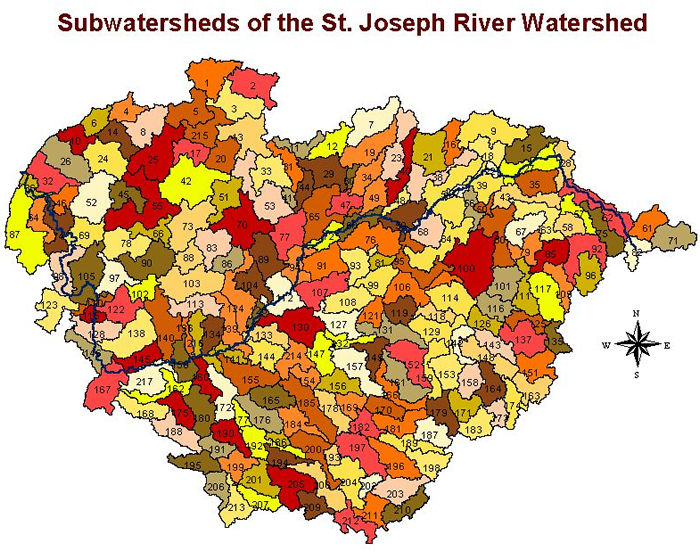
Digital Elevation Modeling using readily available 300-meter pixels from the USEPA BASINS program was utilized to confirm subwatershed boundaries created by the Michigan Department of Enviornmental Quality. The image above illustrates the elevations of the watershed on a 300-meter resolution. The image below illustrates the subwatersheds delineated through the use of this digital elevation data. This method created 162 subwatersheds. The third map illustrates the 167 subwatersheds delineated by the Michigan Department of Environmental Quality using 30-meter elevation data. Variations in the subwatershed boundaries using these two sets of digital data are illustrated by these two subwatershed maps. It can also be seen that large watersheds in Indiana, such as the Pigeon and Elkhart Rivers, were left as one subwatershed, while other watersheds in Michigan were delineated into smaller subwatersheds. A subwatershed shapefile available from the U.S. Geological Survey provides finer-scale delineations of the Pigeon and Elkhart Rivers. However, the use of two different shapefiles (in which the Indiana shapefile is overlaid on the MDEQ shapefile) is problematic for watershed modeling. Note the state line dividing several subwatersheds on the fourth map. Therefore, 30-meter resolution data was utilized to delineate the subwatersheds. The resulting map is shown below at the bottom of the page. This delineation allows all fine-scale subwatersheds to be in one shapefile. A 3-D image was also created. |
 Show
Cities and Main Tributaries.
Show
Cities and Main Tributaries.
Download
a table listing the subwatersheds, their land cover compositions and their
estimated nonpoint source sediment
and phosphorus loading (PDF format).